With stocks hitting all-time highs (at least twice this year), there is no shortage of financial pundits predicting the end of this now-longest-in-history market run. In addition to the length of this bull market, pundits often cite lofty stock valuations as a concern.
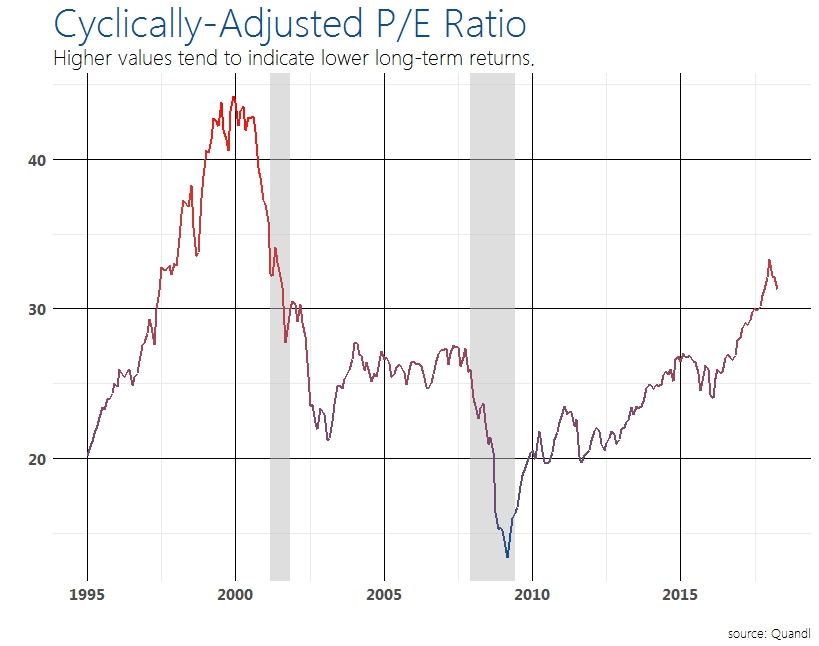
They have a point; stocks are expensive. A widely-accepted measure of valuations is the cyclically-adjusted price to earnings ratio (CAPE ratio for short), and by that measure stocks are more expensive than 90% of their history!
First, what is the CAPE ratio? Most folks are familiar with the concept of the price-to-earnings ratio (P/E for short). The P/E ratio is simply the price per share of a company divided by the earnings per share of the company. You can think of the P/E ratio much more simply: it is the price investors are willing to pay for every $1 of profit. So, if a company makes $2 per share, and the price of that company is $50, then you can infer that investors are paying $25 for every $1 of profit.
That is why P/E is a useful tool for gauging value— all else equal, paying $25 for $1 is more expensive than paying $15 for $1. The CAPE ratio is similar to the traditional P/E, but it adjusts for inflation and looks at a longer period of earnings.
As the chart above shows, with a current CAPE ratio of 33 the S&P 500 has moved firmly into expensive territory. Indeed, across the whole of the 2002 to 2007 expansion, markets stayed firmly below that figure—tracking around the more appropriate 25 level.
Now, when my mind hears “expensive” it immediately equates that to “sell,” or at the very least “don’t buy.” As we learned in the 1990s, however, stocks can stay expensive for a very long period of time. It was June of 1996 when stock valuations first moved above 30. They stayed above that level (even moving above 40) for another six years. And that wasn’t a paltry six years, either, those were legendary boom times.
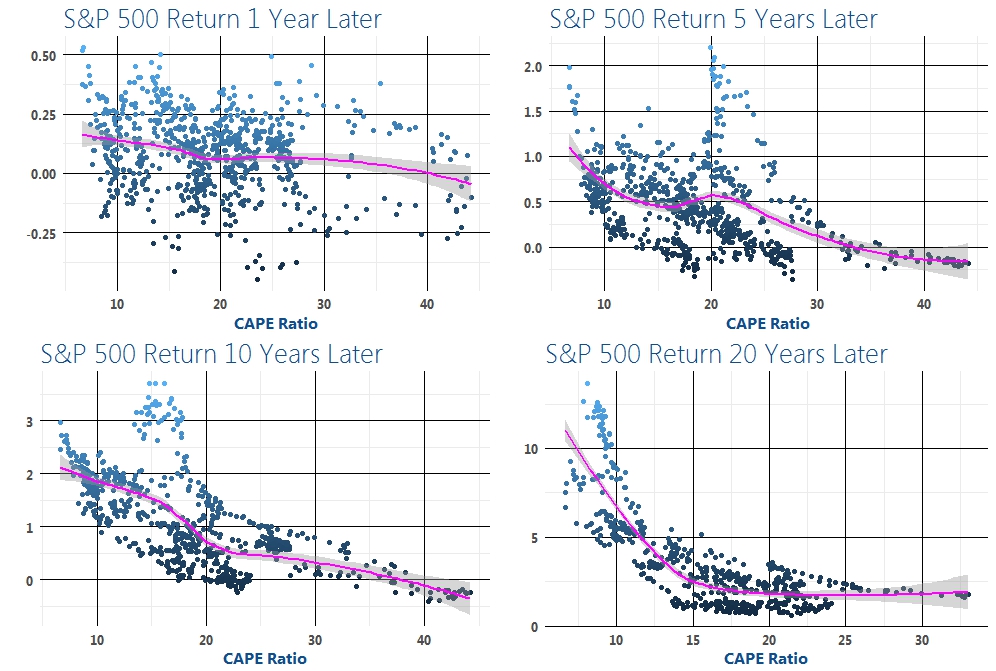
So, what information do valuations give you about future returns? In the chart below, we plot the CAPE ratio against the S&P 500 return 1 year, 5 years, 10 years, and 20 years later. As you can see, there is very little relationship between valuations and 1-year returns, especially in the 30 range. As you move out to 5 and 10 year horizons, however, the relationship tends to get a bit firmer.
This makes intuitive sense as lofty valuations tend to occur near the end of the economic cycle. Returns, then, get reduced through a subsequent recession.
In summary, valuations do not carry much information about returns over the coming year. Of more help to investors is identifying and allocating defensively ahead of recessionary environments. So, don’t be too worried about buying expensive stocks. They may stay that way for a while.
--
All information provided herein is for informational purposes only and should not be relied upon to make an investment decision. This presentation is neither an offer to sell, nor a solicitation of any offer to buy any securities, investment products, or in-vestment advisory service. The presentation is being furnished on a confidential basis to the recipient.
The information herein contains forward looking statements and projections representing the current assumptions and beliefs based on information available to Bright Wealth Management, LLC at time of publishing. This information included is believed to be reasonable, reliable and accurate, (however no representation is made with respect to the accuracy and complete-ness of such data) and is the most recent information available (unless otherwise noted). However, all the information herein, and such beliefs, statements and assumptions are subject to change without notice. All statements made involve risk, uncertainties and are assumptions. Investors may not put undue reliance on any of these statements. There is no guarantee that the market will move in any direction, as there is no way to predict with certainty future market behavior. Due to rapidly changing market conditions and the complexity of investment decisions, supplemental information and other sources may be required to make an informed investment decision based on individual objectives and suitability.
|